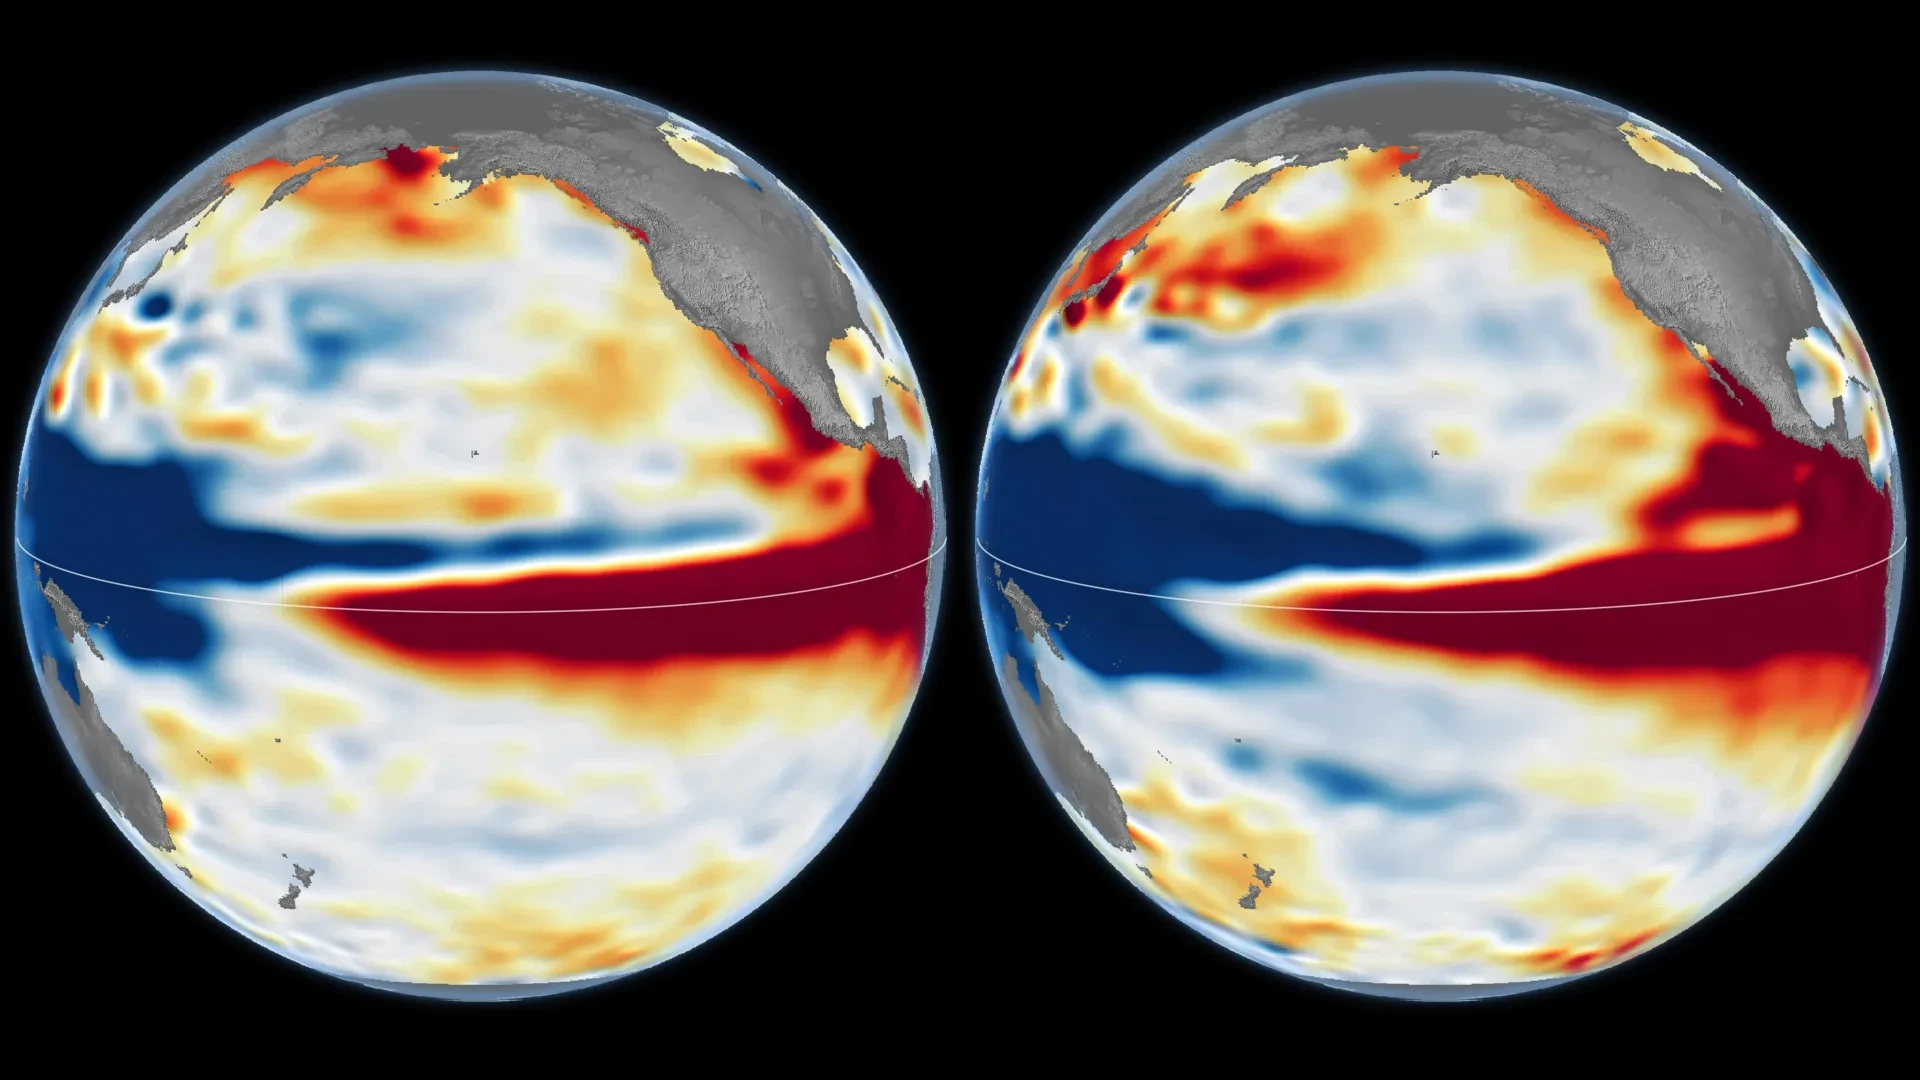
NASA scientists are currently monitoring an exceptionally powerful El Niño climate phenomenon that is exhibiting signs of rapid intensification. Current projections suggest that the 2026 event could potentially eclipse the scale of the historic 1997-98 El Niño, an episode that famously reshaped weather patterns across the globe. By leveraging an unprecedented 35-year record of continuous satellite observations, researchers are now able to draw direct comparisons between the current atmospheric and oceanic shifts and some of the most intense climate events in recorded history. This granular analysis is revealing both remarkable similarities to past "super" El Niños and critical differences that could define the impacts of the coming winter.
El Niño is a recurring, natural climate phenomenon characterized by a significant rise in sea surface temperatures across the equatorial Pacific Ocean. Typically occurring in cycles of two to seven years, this oscillation is far more than a localized ocean disturbance. When ocean temperatures climb above their historical averages, the phenomenon fundamentally disrupts global atmospheric circulation, sending ripples through weather systems that extend thousands of miles away from the Pacific basin.
The two most notable recent examples of this phenomenon occurred in 1997-98 and 2015-16. The consequences of these events were profound and widespread, serving as stark reminders of the ocean’s influence on global stability. During the 1997 event, the world witnessed devastating wildfires in the Amazon and Indonesia, severe droughts that triggered agricultural failure in southern Africa, and intense, record-breaking rainfall that led to destructive coastal flooding throughout Southern California. As the 2026 event begins to mirror these historic episodes, the scientific community is moving to characterize its potential trajectory.
The Mechanics of an El Niño Build-Up
To understand the severity of the 2026 event, it is necessary to look at the delicate interplay between ocean currents and atmospheric winds. Under normal, non-El Niño conditions, steady trade winds blow across the Pacific from east to west. These winds act as a conveyor belt, pushing warm surface water toward the western Pacific. Consequently, the western portion of the ocean accumulates a massive pool of heat, and the sea level in the western Pacific sits slightly higher than it does near the South American coast.
When the trade winds weaken, this established balance collapses. The warm water that had been banked in the west begins to flow eastward across the Pacific basin. This transition often triggers a feedback loop: the shift in water temperature further weakens the trade winds, which in turn allows more warm water to surge eastward. This process effectively flattens the ocean’s surface gradient, raising sea levels and temperatures across the central and eastern Pacific.
However, despite the consistency of these underlying mechanics, no two El Niño events are identical. Their ultimate impact is governed by a variety of volatile factors, including the precise geography of where the warmest water pools and how the global atmosphere responds to the rapidly shifting sea-surface temperatures. Josh Willis, a project scientist for sea level missions at NASA’s Jet Propulsion Laboratory (JPL), notes that the search for a "typical" El Niño is often elusive. According to Willis, while the broad strokes of the phenomenon follow a predictable pattern, the specific outcomes—where the rain falls, where the droughts settle, and how the atmosphere reacts—vary wildly from one event to the next.
Decades of Satellite Data Provide a Benchmark
To decode the behavior of the 2026 El Niño, NASA scientists are utilizing satellite altimetry—a technique that measures the elevation of the ocean surface with extreme precision. Because seawater expands as it absorbs heat, the elevation of the ocean surface acts as a proxy for heat content. When satellites detect unusually high sea levels in the central and eastern equatorial Pacific, researchers can map exactly where heat is accumulating.
NASA recently released comparison maps utilizing data from October 13, 1997, and October 12, 2026. The 1997 data was captured by the pioneering TOPEX/Poseidon satellite, while the 2026 imagery was provided by the modern Sentinel-6 Michael Freilich mission. JPL scientists processed both datasets to ensure they were comparable, using a standardized methodology that accounts for long-term climate trends and seasonal variations. The resulting maps use a color-coded system—red for higher-than-average sea levels, white for normal, and blue for depressed levels—to visualize the heat distribution.
The true power of these observations lies in their consistency. NASA’s fleet of satellites has maintained nearly identical orbital paths for over three decades, with each mission overlapping with its predecessor. This "daisy-chain" of data ensures that the 2026 observations can be laid over the 1997 data with high confidence. "What’s unique about altimetry is that we have a 35-year record from nearly identical satellites flying almost the same ground track," Willis explained. "That lets us look back in time and compare this El Niño to what happened in 1997. And right now, this one is on track to be even bigger."
Analyzing the 2026 Climate Giant
The current event has intensified with a speed that exceeded the 1997-98 development, yet the structural signatures of both events remain strikingly similar. In both instances, satellite data shows a pronounced sea-level disparity: significantly lower levels in the western Pacific and a massive, elevated bulge of warm water pushing toward the South American coast.
This similarity suggests that the 2026 event could trigger weather patterns similar to those of the late 1990s, potentially bringing heavy, sustained precipitation to California and the southern United States throughout the winter months. However, scientists caution against assuming that a similar ocean profile guarantees identical weather. The 2015-16 El Niño serves as a cautionary tale in this regard.
When researchers compare the 2015-16 data—recorded by the Jason-2 satellite—to the 1997 and 2026 events, they find that while the 2015 event also featured immense heat, the spatial distribution differed. In 2015, the warm water did not extend as strongly toward the coast of South America. Consequently, the atmospheric response diverged; instead of the heavy rainfall seen in the U.S. West during 1997, the 2015-16 event shifted precipitation patterns toward Central America and the southeastern United States, while Mexico suffered from significant flooding.
Preparing for the Winter Outlook
As the winter of 2026-27 approaches, the scientific community is focused on the potential for extreme weather. In its official outlook issued on October 8, 2026, the National Oceanic and Atmospheric Administration (NOAA) calculated an 83 percent probability that the Pacific would remain in a strong-to-very-strong El Niño state through the first quarter of 2027.
While this forecast provides a high-confidence prediction of the ocean’s state, it remains challenging to pin down the exact geographic impacts. El Niño acts as a global atmospheric driver, but its influence is mediated by local atmospheric conditions that can either amplify or dampen its effects. As the influence of the phenomenon radiates away from the tropical Pacific, the precision of long-range weather forecasting naturally declines.
Ultimately, the 2026 El Niño remains a developing story. While NASA’s satellite record provides an invaluable tool for tracking the magnitude of the heat buildup, the specific outcome for the coming months remains subject to the chaotic, evolving interaction between the ocean and the atmosphere. As Willis noted, the current state of the Pacific is the best available indicator, but there is always a degree of unpredictability involved. Whether 2026-27 joins the ranks of history’s most disruptive climate events will depend on the final, complex choreography of weather systems in the coming months. Researchers continue to monitor the satellite data daily, watching to see how these historic similarities play out in real-time.